Documentation

Have Questions?
We Have Answers.

Learn everything about how ScalperIQ works in MotiveWave & EdgeProX

Overview

ScalperIQ is a suite of technical indicators designed for analyzing intraday order flow dynamics. The suite consists of the ScalperIQ Tick Engine and three studies — Delta Flow, Phantom, and Impact — each offering a unique perspective on market microstructure.

The Tick Engine processes raw tick data and provides it to each study. Delta Flow highlights changes in buying and selling pressure through candle coloring, delta pivot markers, and adaptive zone overlays. Phantom detects breakout escapes by tracking the largest individual trades on each bar. Impact identifies size imbalances using adaptive thresholds and marks levels where unusually large trades occurred.

Together, these tools provide structured visual data intended to support timely, informed decision-making.

This suite is currently available for use on MotiveWave and EdgeProX platforms. Support for NinjaTrader 8 is also available — see the NinjaTrader documentation for platform-specific setup.

What Is Delta?

Delta measures the difference between aggressive market orders executed at the ask versus bid prices. When more orders are executed at the ask, delta is positive, indicating buying pressure. Conversely, when more orders are executed at the bid, delta is negative, reflecting selling pressure. Delta analysis can help identify short-term imbalances and shifts in control between buyers and sellers.

How It Works

ScalperIQ processes tick-level data through the Tick Engine, which aggregates raw tick information into per-bar metrics including delta, max trade sizes, and volume by price. Each study reads this shared data and applies its own analysis.

Delta Flow calculates bar-level delta values and visualizes them through candle coloring, delta pivot markers, and adaptive zone overlays. Phantom tracks the largest individual trades per bar and detects breakout escapes — moments where an unusually large trade pushes price beyond a key level. Impact identifies size imbalances using adaptive thresholds and marks levels where aggressive participation was significantly above normal.

All components are configurable to suit various styles of trading, with options to optimize both performance and visual clarity.

ScalperIQ Portal

The portal manages your ScalperIQ installation and licensing. Download versions, retrieve license keys, and transfer licenses to new devices at portal.scalperiq.com.

How To Access The Portal

  1. Visit portal.scalperiq.com/portal
  2. Enter your email address and click "Send Link"
  3. Receive a secure, one-time sign-in link (expires in 10 minutes)
  4. Open the secure email link to access your dashboard
  5. Dashboard options: Download ScalperIQ, Download License, Move License, Contact Support
Portal login page Secure sign-in email Portal dashboard

Moving Your License

Licenses are "node-locked," binding to one computer at a time. To transfer:

  1. Close MotiveWave or EdgeProX on all machines
  2. Copy license file to Extensions folder on new machine
  3. Go to portal and click "Move License"
  4. Open platform on new computer

You can move licenses up to twice every 24 hours.

Installation

Currently, ScalperIQ is available for MotiveWave 6 & 7, EdgeProX, and NinjaTrader 8. Before installing, reduce linear/non-linear bars and loaded days for stability.

  1. Access portal and sign in
  2. Download license file and the ScalperIQ .jar file
  3. Place both files in the Extensions folder
Chart settings — reduce bar count for stability

Installing on Windows

  1. Close MotiveWave or EdgeProX
  2. Locate downloaded files in Downloads folder
  3. Copy both files
  4. Navigate to: C:\Users\[Your Username]\MotiveWave Extensions
  5. Paste files
  6. Restart platform

Installing on macOS

  1. Close MotiveWave or EdgeProX
  2. Open Finder and navigate to Downloads
  3. Copy both files
  4. Navigate to: Users → [Your Username] → MotiveWave Extensions
  5. Paste files
  6. Restart platform
macOS installation — MotiveWave Extensions folder

Updating to New Version Windows

  1. Close MotiveWave or EdgeProX
  2. Navigate to Extensions folder: C:\Users\[Your Username]\MotiveWave Extensions
  3. Locate the previous .jar file for ScalperIQ and delete it
  4. Download new version from portal
  5. Place in Extensions folder
  6. Restart platform
  7. Add new version to chart

Updating to New Version macOS

  1. Close MotiveWave or EdgeProX
  2. In Finder, navigate to: Users → [Your Username] → MotiveWave Extensions
  3. Locate the previous .jar file for ScalperIQ and delete it
  4. Download new version from portal
  5. Place in Extensions folder
  6. Restart platform
  7. Add new version to chart

Getting Started

The ScalperIQ Tick Engine is the foundation of the ScalperIQ suite. It processes raw tick data and makes it available to each study on your chart. You must add the Tick Engine to your chart before adding any other ScalperIQ study.

Step 1: Add the Tick Engine

Go to Study > ScalperIQ > ScalperIQ Tick Engine and add it to your chart. The engine will begin loading historical tick data.

Step 2: Add Your Studies

Once the Tick Engine is loaded, add one or more studies from the same menu:

  • ScalperIQ Delta Flow — Candle coloring, delta zones, pivots, and exhaustion markers
  • ScalperIQ Phantom — Breakout escape detection via max trade size tracking
  • ScalperIQ Impact — Size imbalance detection with adaptive thresholds

Each study automatically connects to the Tick Engine on the same chart. If you add a study without the Tick Engine present, it will display a message asking you to add the engine first.

Step 3: Configure

The Tick Engine controls global settings like the color theme and RTH mode. Each study has its own settings for its specific visual outputs. See the individual study sections below for details.

MotiveWave Study menu — ScalperIQ studies

Tick Engine

The ScalperIQ Tick Engine is the core data source for all ScalperIQ studies. It processes every tick on the chart and aggregates key metrics for each bar — including delta, maximum buy/sell trade sizes, and volume by price.

The Tick Engine must be added to your chart before any other ScalperIQ study. It also handles:

  • License validation — Your license is checked once by the engine. If valid, all studies are automatically authorized.
  • Environment validation — The engine verifies you're on a supported futures instrument with a timeframe of 30 minutes or less.
  • Color theme management — When a custom theme is enabled on the engine, it overrides the color settings on all studies. If no theme is enabled, each study uses its own local color settings.

Themes

  • Use Custom Color Theme: Enables a predefined color theme applied across all ScalperIQ studies on the chart.
  • Color Theme: Selects the active theme (Vector, Classic, Ember, Pulse, Polar, Thermal, or Obsidian).
Tick Engine themes settings

Session

  • RTH Only (All Studies): Restricts analysis to Regular Trading Hours across all studies when enabled.
Tick Engine session settings

Delta Flow

ScalperIQ Delta Flow visualizes changes in buying and selling pressure through candle coloring, delta pivot markers, exhaustion markers, and adaptive zone overlays. It reads bar-level delta data from the Tick Engine and applies its own analysis to highlight shifts in market control.

Candle Colors & Averaging Period

  • IQBoost: Weights price movement with delta intensity for faster, adaptive reactions
  • Positive Delta Color: Represents buying aggression
  • Negative Delta Color: Represents selling aggression
  • Enable Candle Coloring: Color-codes candles by delta value
  • Averaging Period (Bars): Sets bars for delta averaging; shorter periods = more responsive
  • Delta Threshold: Influences coloring aggressiveness; higher values emphasize stronger deltas
Candle colors settings

Zone Settings

  • Enable Zone Drawing: Toggles delta zone display
  • Zone Opacity: Adjusts zone transparency
Zone settings

Delta Pivot Settings

Delta pivots mark locations where buying and selling aggression has flipped with intensity. These are not trade signals.

  • Draw Delta Pivots: Enables pivot markers
  • Minimum Delta Pivot Intensity: Sets required delta deviation
  • Delta Pivot Colors: Separate colors for buying-to-selling and selling-to-buying transitions
  • Delta Pivot Marker Size: Controls symbol size
Delta pivot settings

Exhaustion Marker Settings

Exhaustion markers are early warning signals for potential trend reversals or pauses, identifying where strong momentum moves lose steam.

  • Draw Exhaustion Markers: Toggles visibility
  • Buyer/Seller Exhaustion Colors: Marks pressure exhaustion
  • Exhaustion Marker Size: Adjusts visual size
  • Min Hot Bars Before Exhaustion: Minimum consecutive high-momentum bars
  • Cooldown Bars Before Marker: Lower-momentum bars confirming exhaustion (can be set to 0)
Exhaustion marker settings

Session Time Settings

  • Use RTH Data Only: Restricts Delta Flow analysis to regular trading hours if enabled
Session time settings

Session Limits

Session Limits control how many Delta Pivots, Delta Zones, and Exhaustion Markers are displayed per session. Signals are ranked by intensity — if a newer signal is stronger than an existing one, the weaker signal is replaced to keep the chart clean.

  • Max # of Delta Pivots: Upper limit per session
  • Max # of Delta Zones: Caps zones per session
  • Max # of Exhaustion Markers: Caps markers per session
Session limits settings

Advanced Settings

  • Invert Zone Colors: Reverses zone color display (visual only)
  • Extend Zones Across Sessions: Allows zones to persist beyond formation session
  • First Session to Extend: Shows previous zones starting with specified session
  • Last Session to Extend: Cuts out previous session zones
Advanced settings

Phantom

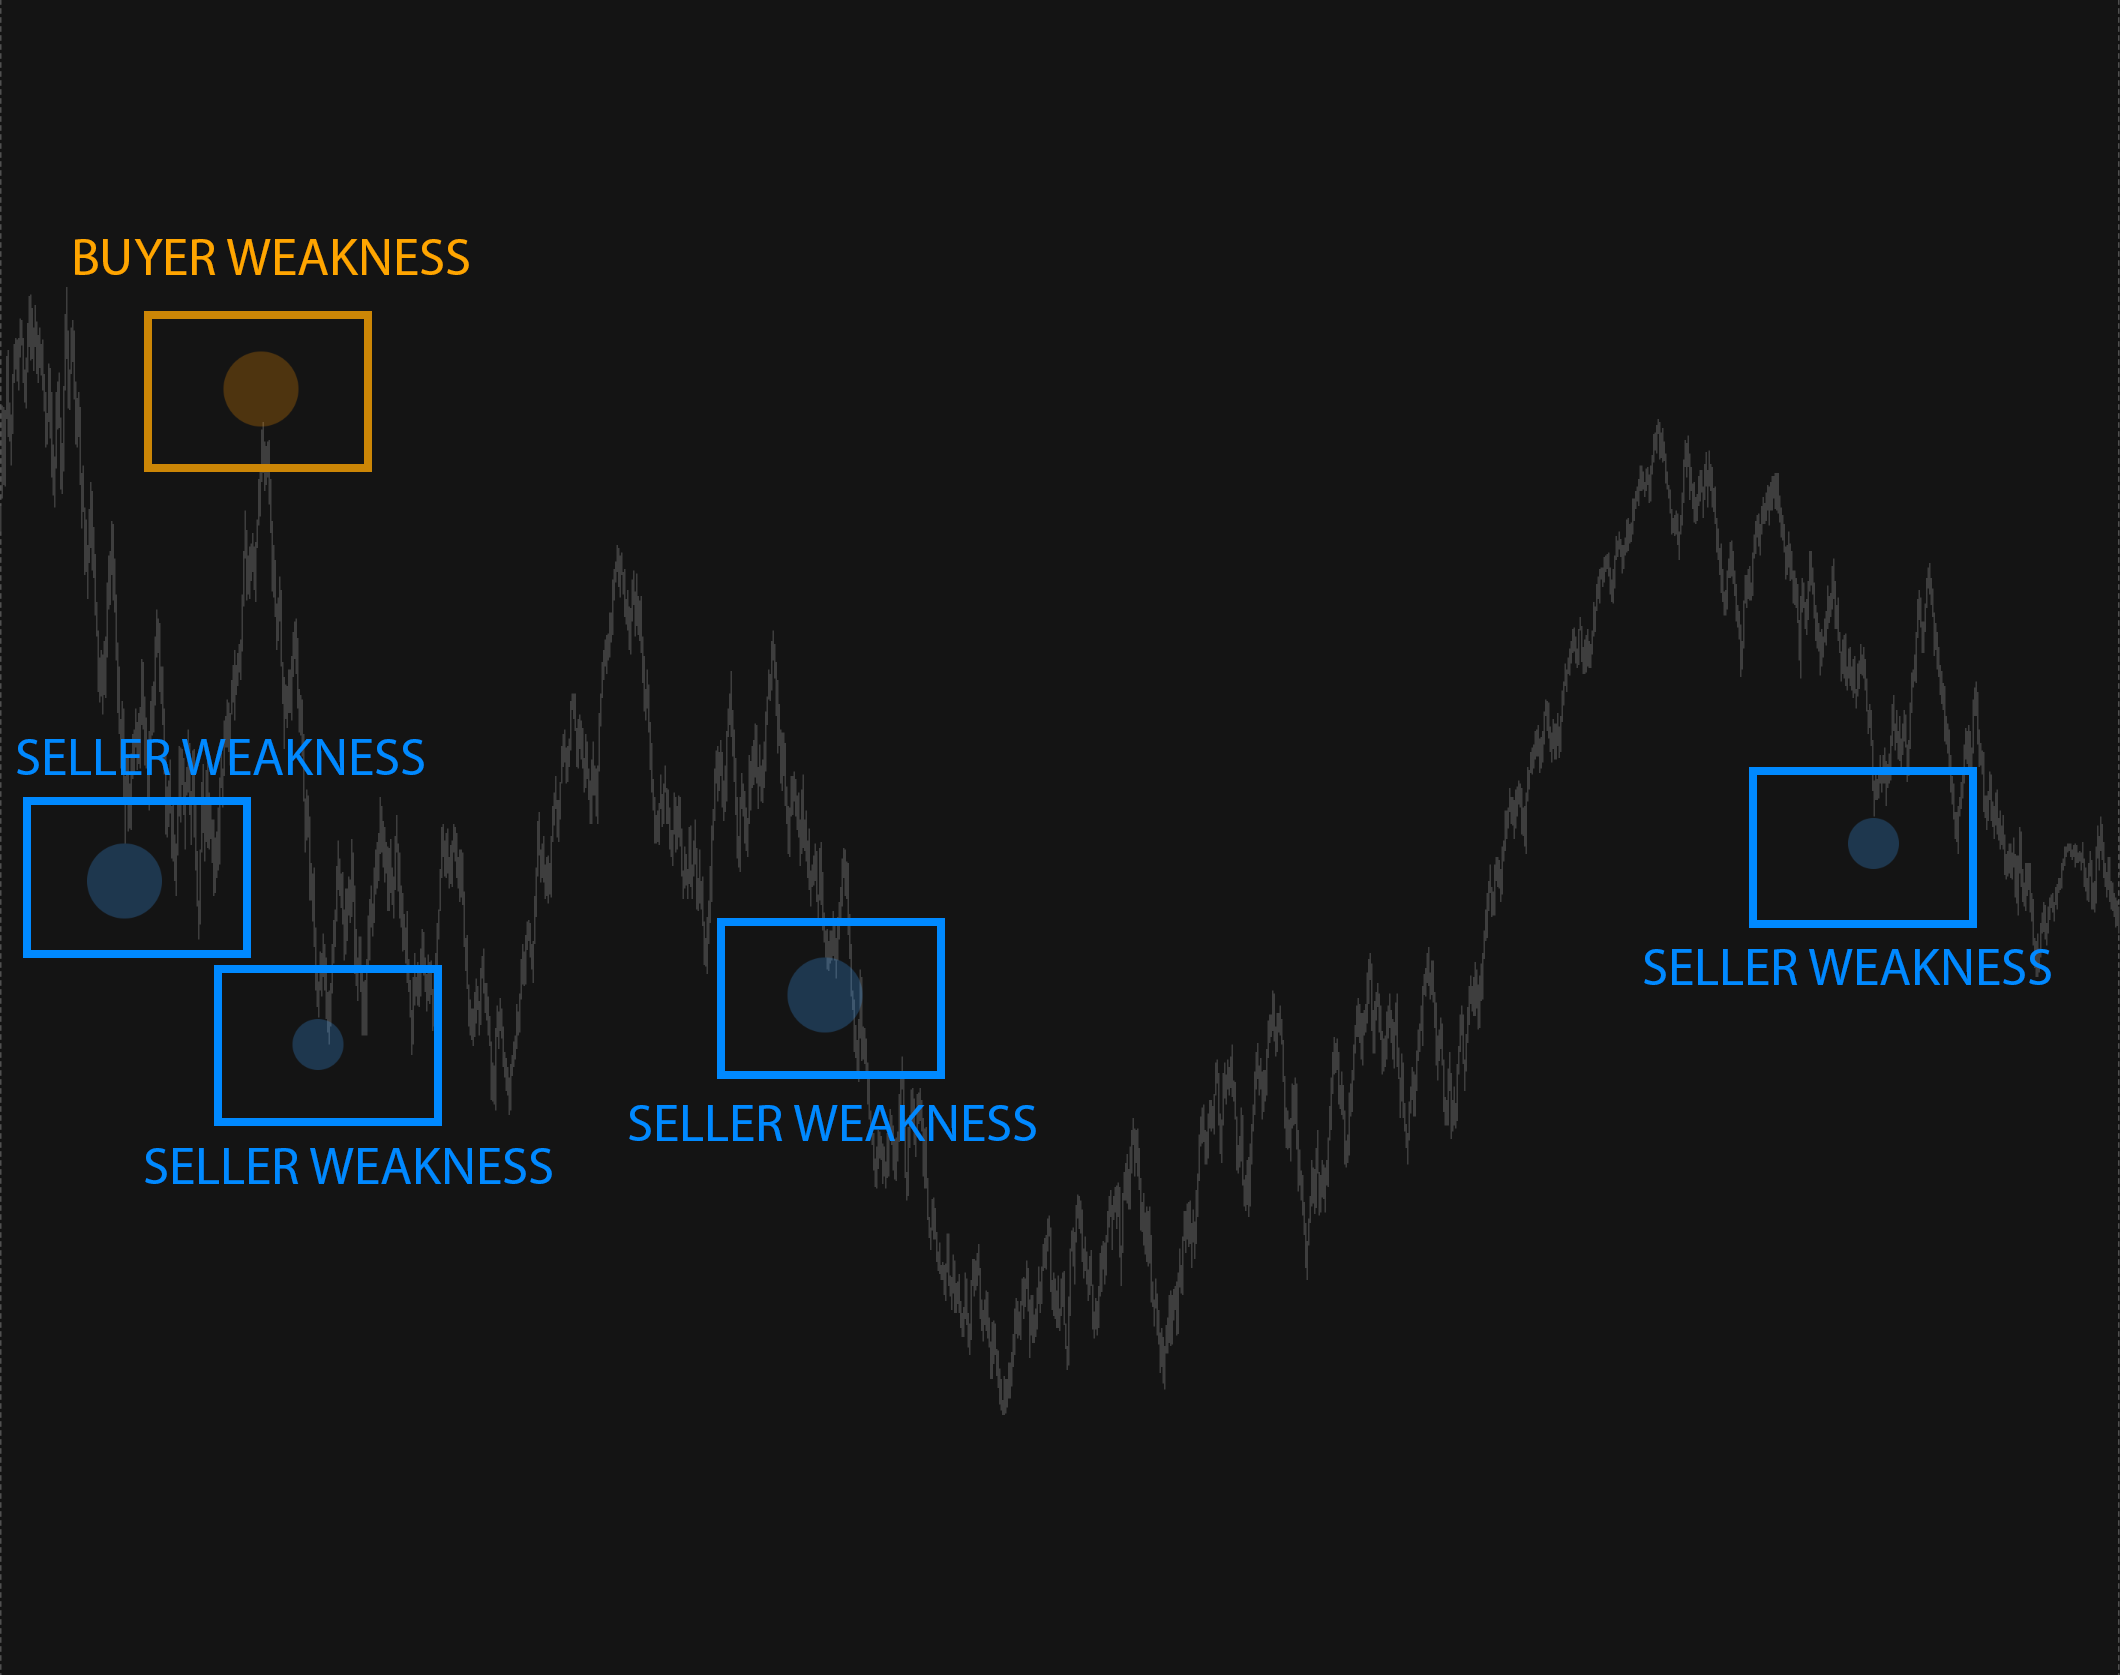
ScalperIQ Phantom identifies potential failed breakouts by detecting moments where price pushes to new extremes without order flow confirmation. When price extends beyond its range but delta does not support the move, Phantom marks it with a bubble — a visual cue that the breakout may lack conviction and a reversal could follow.

  • Upper escapes (bubble above bar): Price pushed to a new extreme high, but buying pressure did not confirm the move
  • Lower escapes (bubble below bar): Price pushed to a new extreme low, but selling pressure did not confirm the move

General Settings

  • Marker Opacity (%): Controls the transparency of escape bubbles on the chart.
  • Max Markers per Session: Limits the number of escape bubbles displayed per session.
  • Upper Marker Color: Color of bubbles drawn above bars for upper breakout escapes.
  • Lower Marker Color: Color of bubbles drawn below bars for lower breakout escapes.
Phantom general settings

Advanced Settings

  • Min Spacing (minutes): Minimum time between escape markers to prevent clustering.
  • Dynamic Dot Sizing: When enabled, bubble size scales with the magnitude of the escape.
  • Fixed Dot Size (px): The base size of escape bubbles when dynamic sizing is disabled.
  • Min Dot Size (px): The minimum bubble size rendered, preventing bubbles from becoming too small.
  • Bar Offset (px): Controls the vertical distance between the bubble and the bar.
Phantom advanced settings

Session Settings

  • Use RTH Data Only: When enabled, Phantom only tracks escapes during Regular Trading Hours.
Phantom session settings Phantom escape bubbles on chart

Impact

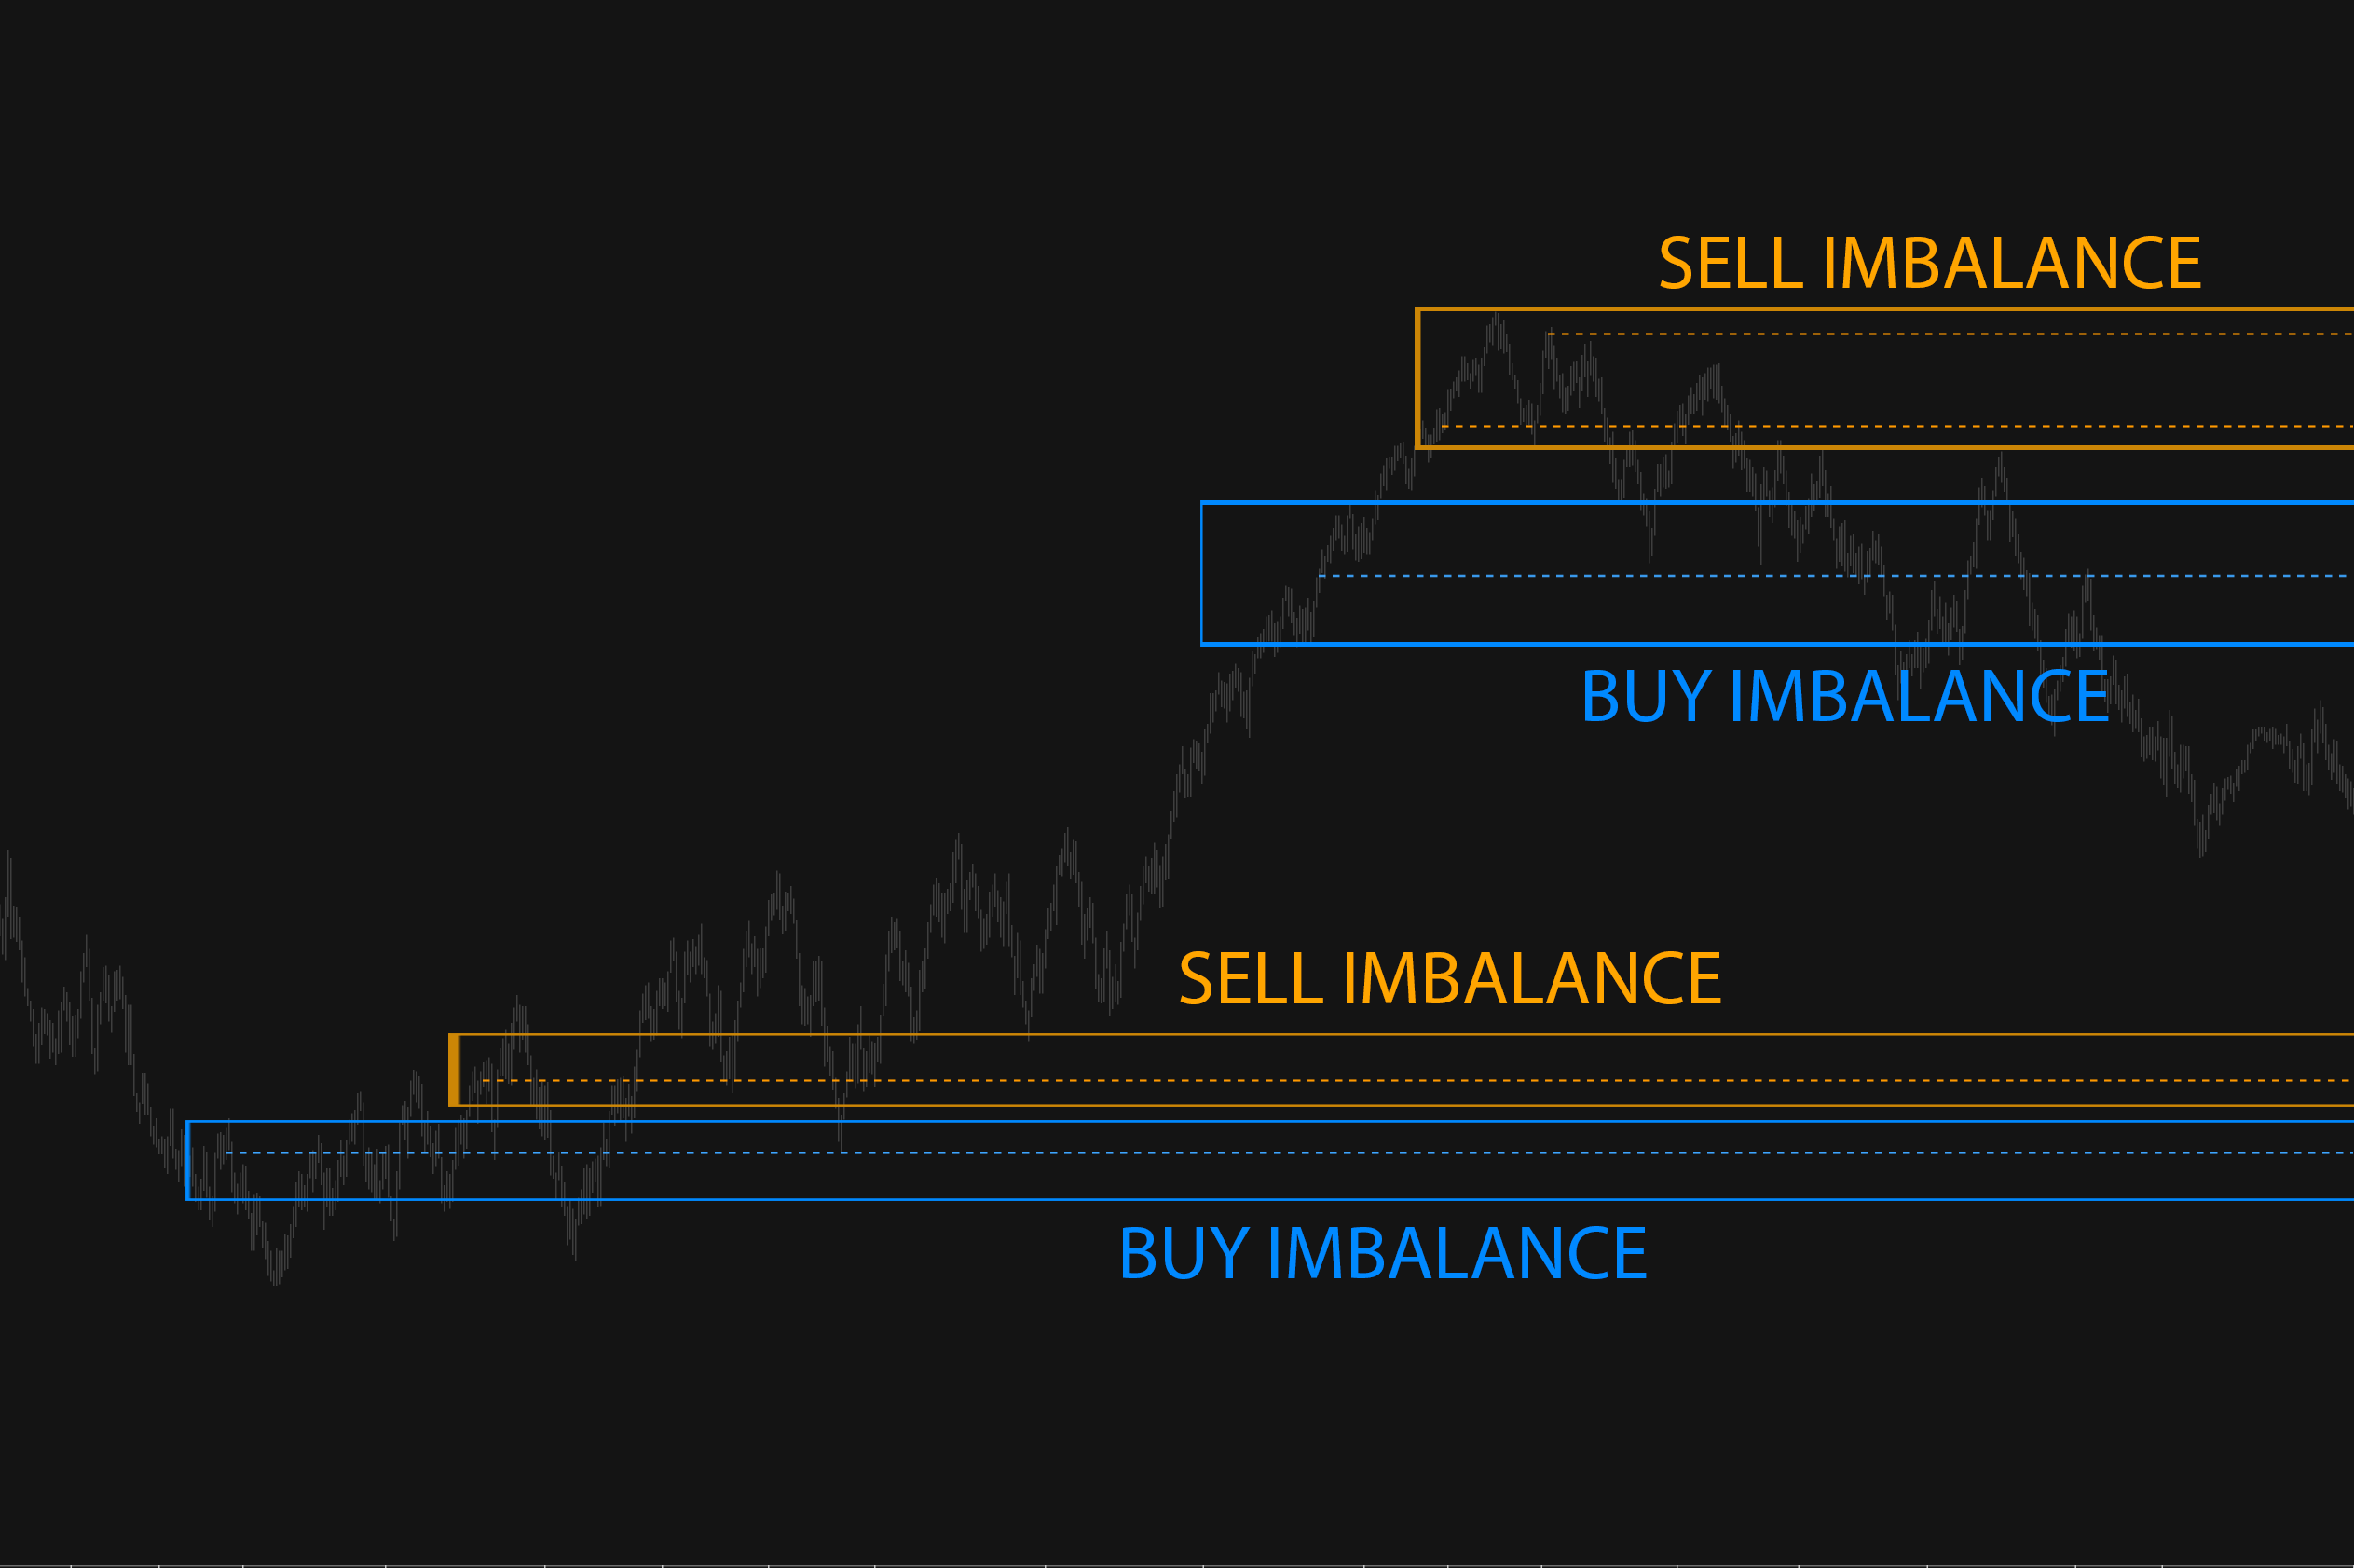
ScalperIQ Impact marks price levels where unusually large trades occurred relative to normal session activity. When detected, Impact draws a dashed horizontal line at that price, giving you a visual reference for where significant participation entered the market.

  • Buy imbalance levels mark where an outsized buy trade occurred
  • Sell imbalance levels mark where an outsized sell trade occurred

These levels can act as reference points for potential support, resistance, or areas of interest.

General Settings

  • Max Levels on Chart: Limits the number of imbalance levels displayed at once.
  • Level at Trade Price: When enabled, draws the level at the exact price where the outsized trade occurred.
  • Line Width: Controls the thickness of imbalance level lines.
  • Buy Imbalance Color: Color of levels drawn for large buy trade imbalances.
  • Sell Imbalance Color: Color of levels drawn for large sell trade imbalances.
Impact general settings

Advanced Settings

  • Extend Across Sessions: Allows imbalance levels to persist beyond the session in which they were formed.
  • Nearest Session: Sets the most recent session from which to extend levels (1 = most recent completed).
  • Furthest Session: Sets the oldest session from which to extend levels.
Impact advanced settings

Session Settings

  • Use RTH Data Only: When enabled, Impact only tracks imbalances during Regular Trading Hours.
Impact session settings Impact imbalance levels on chart

Custom Themes

Custom themes apply a consistent color scheme across all ScalperIQ studies on your chart. Themes are configured on the Tick Engine and automatically propagated to Delta Flow, Phantom, and Impact.

Enabling a custom theme on the Tick Engine overrides the individual color settings on all studies. If no theme is enabled, each study uses its own local color settings.

Use Custom Color Theme: Enables use of a predefined theme. Set this on the Tick Engine.

Color Theme: Selects a theme from available options:

  • Vector — Neon Green & Purple
  • Classic — Green & Red
  • Ember — Orange & Pink
  • Pulse — Blue & Orange
  • Polar — Blue & Pink
  • Thermal — Purple & Orange
  • Obsidian (for light colored chart backgrounds) — Blue & Red
Tick Engine theme settings

How to Interpret Signals

ScalperIQ highlights delta shifts and order flow dynamics that reflect underlying changes in market microstructure. The following signals provide visual cues for changes in buying and selling pressure across the ScalperIQ suite.

Candle Colors

Positive delta candles reflect buying pressure. Negative delta candles reflect selling pressure.

Candle color signals

Delta Pivots

Not entry or exit signals — these mark moments where market control changes hands.

Delta pivot signals

Delta Zones

Zones form where delta intensity reaches significant thresholds. When sell zones are reclaimed by buyers, they may subsequently act as support, and vice versa.

Delta zone signals

Exhaustion Markers

Contextual signals indicating where aggressive buyers or sellers are no longer pressing, suggesting reduced continuation likelihood without consolidation.

Exhaustion marker signals

Impact Levels

Impact levels mark prices where outsized trade activity occurred. Similar to delta zones, these levels can act as areas of interest for potential support or resistance. When a sell imbalance level is reclaimed by buyers, it may act as support — and vice versa for buy imbalance levels reclaimed by sellers.

Impact imbalance levels on chart

Phantom Escapes

Phantom bubbles appear when price pushes to new extremes without delta confirmation — meaning the breakout lacks order flow conviction. These escape signals are often early indicators that a reversal could be in store, as the move has extended beyond its range without the buying or selling pressure to sustain it.

Phantom escape bubbles on chart

Supported Bar Types

  • Tick
  • Linear (up to 30 min time frame)**
  • Constant Volume
  • Range
  • Renko
  • Hybrid Renko
  • NT Renko
  • Point & Figure
  • Reversal

*Note that loading times for linear charts may be long. We recommend reducing the # of bars on your chart when using linear bars.

Use Cases

ScalperIQ supports a variety of short-term and intraday strategies. The suite is best used in conjunction with other price action or volume-based tools.

Trend Confirmation: Persistent delta alignment with price movement helps confirm trend direction. Strong positive delta in a rising market suggests sustained buyer control.

Reversal Awareness: Aggressive shifts in delta (e.g., through pivots) may precede price reversals. Exhaustion markers can show where extreme moves are cooling off. Phantom escape bubbles flag moments where price pushed to extremes without order flow confirmation — early indicators that a breakout is failing and a reversal may follow.

Entry Timing for Scalping: Scalpers may use delta pivots, high-intensity delta zones, and Impact levels to identify precise moments of temporary imbalance that provide edge for short-duration trades.

Breakout Validation: Breakouts supported by strong directional delta are generally more reliable. Phantom bubbles at price extremes can signal that a breakout lacks conviction — price extended without order flow support, suggesting the move may fail and a reversal could follow. Weak delta on a breakout may indicate a potential fake out.

Support/Resistance Refinement: Delta zones and Impact levels provide refined intraday support and resistance based on aggressive order activity rather than static levels. Impact levels highlight where outsized trades occurred, while delta zones reflect areas of cumulative pressure.

Platform Support

ScalperIQ is currently available for use on the MotiveWave, EdgeProX, and NinjaTrader platforms. If you have platform-specific questions unrelated to ScalperIQ regarding installation, chart settings, or general usage, please refer to the respective platform documentation:

FAQs & Troubleshooting

I see "Waiting for ScalperIQ Tick Engine..." — what does this mean?

ScalperIQ studies (Delta Flow, Phantom, Impact) require the Tick Engine to be on the same chart. Go to Study > ScalperIQ > ScalperIQ Tick Engine and add it first. Once the engine is loaded, your studies will automatically connect and begin displaying data.

I added the Tick Engine but my study still isn't showing data.

The Tick Engine needs a moment to process historical tick data after being added. Wait for the engine's loading message to clear. If the issue persists, try removing and re-adding the study. Make sure both the engine and the study are on the same chart with the same instrument and bar type.

Why do positive delta candles appear in downtrends?

Due to averaging period smoothing, higher periods show delayed reactions to order flow changes.

Candles aren't colored after license placement?

Toggle a setting, remove and reapply the study, verify license placement, restart platform, or contact support.

Why do zones change position with averaging period changes?

Modifications alter delta calculations, affecting what qualifies as significant shifts.

I see less zones/delta pivots than in my max settings. Why?

The setting specifies the maximum number of pivots/zones that may be displayed. If fewer pivots/zones appear, it means fewer qualifying areas were detected than the max setting.

Why isn't candle coloring active?

Ensure "Enable Candle Coloring" is active and delta exceeds threshold. Custom themes disable individual color overrides.

Delta pivots not visible?

Confirm "Draw Delta Pivots" is enabled.

Slow indicator performance?

Reduce chart bars via Chart Settings and Max Linear/Non-Linear Bar count. Remove and reapply the study: delete the study from your chart and reapply it.

Can I use during pre-market/extended hours?

Yes, uncheck "Use RTH Data Only."

Why do I see different signals than another user on the same asset and timeframe?

Tick data is inherently noisy and can vary slightly between users due to differences in data feed timing or how local data is stored. Complete synchronization between users may not always be possible, especially if one user's chart has been running longer than another's.

However, differences in alignment do not reduce the accuracy of signals. The indicator is designed to adapt to incoming data consistently, meaning that even if two users see slight variations, the signals themselves remain reliable and relevant for each user's setup.

For all other questions please email info@scalperIQ.com

Ready to see it on your chart?

Try Free for 14 Days

No credit card required.